python日期格式转换
import time
# timeNum=1566366547705#毫秒时间戳
timeNum= 1601974038267
timeTemp = float(timeNum/1000)
tupTime = time.localtime(timeTemp)
stadardTime = time.strftime("%Y-%m-%d %H:%M:%S", tupTime)
print(stadardTime)
```<!--autointro-->
import time
# timeNum=1566366547705#毫秒时间戳
timeNum= 1601974038267
timeTemp = float(timeNum/1000)
tupTime = time.localtime(timeTemp)
stadardTime = time.strftime("%Y-%m-%d %H:%M:%S", tupTime)
print(stadardTime)
```<!--autointro-->Based on the code snippet you provided, it seems like you are using Matplotlib, a popular Python library for creating visualizations.
The plt module in Matplotlib provides an interface for creating plots, while the h_fig.canvas.toolbar.zoom() method is used to enable zooming functionality on a plot.
To avoid multiple calls to h_fig.canvas.toolbar.zoom() from causing the zooming feature to become ineffective, you can check if the zooming feature has already been enabled before calling the method again. One way to do this is to use a boolean flag to keep track of whether the zooming feature has been enabled or not. Here’s an example:
import matplotlib.pyplot as plt
# Create a figure and plot some data
fig, ax = plt.subplots()
ax.plot([1, 2, 3], [4, 5, 6])
# Enable zooming feature if it hasn't been enabled yet
if not hasattr(fig.canvas.toolbar, '_id_drag_zoom'):
fig.canvas.toolbar.zoom()
# Show the plot
plt.show()
In this example, the hasattr() function is used to check if the '_id_drag_zoom' attribute has been set on the toolbar object. This attribute is set when the zooming feature is enabled, so if it exists, it means that the feature has already been enabled and there’s no need to call h_fig.canvas.toolbar.zoom() again.
By checking for this attribute, you can ensure that the zooming feature is only enabled once, even if the code that calls h_fig.canvas.toolbar.zoom() is executed multiple times.
如果你在函数内部使用全局变量,而没有进行声明,Python 将会认为这是一个局部变量,而不是全局变量。这样就会导致在函数中无法访问到全局变量,同时也可能出现一些意料之外的行为。
要在函数内部使用全局变量,可以使用global关键字来声明。例如:
x = 0  # 全局变量
def my_function():
global x  # 声明 x 为全局变量
x = 1    # 修改全局变量 x 的值
my_function()
print(x) # 输出 1在上面的示例代码中,我们在函数内部使用了全局变量x,并使用global关键字在函数内部声明了x为全局变量。
需要注意的是,在函数中修改全局变量的值会影响到所有使用该全局变量的代码。因此,使用全局变量需要谨慎,最好避免在函数中修改全局变量的值,而是应该通过函数的参数和返回值来传递数据。
可以使用 plt.get_fignums() 函数获取当前所有的 Figure 对象的编号列表,然后使用 plt.figure() 函数判断是否存在指定编号的 Figure 对象。如果存在,则获取该 Figure 对象的句柄,并使用 fig.add_subplot() 函数创建子图并作图;如果不存在,则使用 plt.figure() 函数创建新的 Figure 对象,并使用 fig.add_subplot() 函数创建子图并作图
可以使用 plt.figure() 函数创建新的 Figure 对象,并使用循环语句创建编号从 1 到 10 的 10 个 Figure 对象。下面是一个简单的例子:
import matplotlib.pyplot as plt
for i in range(1, 11):
fig = plt.figure(i)
plt.plot([0, 1], [0, 1])
plt.title('Figure {}'.format(i))
在这个例子中,使用循环语句创建编号从 1 到 10 的 10 个 Figure 对象。在每个循环中,使用 plt.figure() 函数创建一个新的 Figure 对象,并指定 Figure 对象的编号为当前循环变量 i。然后,使用 plt.plot() 函数在该 Figure 对象中画一条直线,以便在图像中显示出来。最后,使用 plt.title() 函数为该 Figure 对象设置标题,标题内容为 "Figure i",其中 i 为当前循环变量。
需要注意的是,如果已经有一个 Figure 对象使用了指定的编号,那么 plt.figure() 函数将返回该 Figure 对象。因此,在本例中,如果之前已经创建了编号为 1 的 Figure 对象,则在第一次循环中,将会获取到该 Figure 对象,而不是创建一个新的 Figure 对象。如果需要创建新的 Figure 对象,请确保使用未被占用的编号。
要在每个 Figure 对象中创建子图,并在子图中作图,可以使用 fig.add_subplot() 函数创建子图,并使用 subplot.plot() 函数在子图中作图。下面是一个例子:
import matplotlib.pyplot as plt
import numpy as np
for i in range(1, 11):
fig = plt.figure(i)
fig.suptitle('Figure {}'.format(i))
for j in range(1, 4):
ax = fig.add_subplot(1, 3, j)
ax.plot(np.linspace(0, 10, 100), np.sin(np.linspace(0, 10, 100*j)))
ax.set_title('Subplot {}'.format(j))
plt.show()
在这个例子中,首先创建了 10 个 Figure 对象,编号分别为 1 到 10,然后使用循环创建子图。在每个 Figure 对象中,使用 fig.add_subplot() 函数创建 1 行 3 列的子图网格,并依次在第 1、2、3 个子图中作图。在每个子图中,使用 ax.plot() 函数画出一条正弦曲线,并使用 ax.set_title() 函数设置子图标题。最后,使用 fig.suptitle() 函数为每个 Figure 对象设置总标题。
需要注意的是,fig.add_subplot() 函数的参数 1, 3, j 表示将子图网格分为 1 行 3 列,当前子图位于第 j 列。在本例中,j 的取值为 1、2、3,因此创建了 3 个子图。如果需要创建不同行列数的子图网格,可以相应地修改这些参数。
在本例中,使用了 numpy 库生成正弦曲线进行演示,您可以根据自己的需要修改 ax.plot() 函数的参数,作出您需要的图形。最后,使用 plt.show() 函数显示所有的图形。
在 Matplotlib 中,可以使用 clf() 函数来清空当前 Figure 对象中的所有曲线。该函数会将 Figure 对象中的所有 Axes 对象都清空,并将其状态重置为默认状态。下面是一个简单的例子:
import matplotlib.pyplot as plt
import numpy as np
# 画出两条曲线
plt.plot(np.linspace(0, 10, 100), np.sin(np.linspace(0, 10, 100)))
plt.plot(np.linspace(0, 10, 100), np.cos(np.linspace(0, 10, 100)))
# 清空当前 Figure 对象中的所有曲线
plt.clf()
在这个例子中,首先使用 plot() 函数画出了两条曲线。然后使用 clf() 函数清空当前 Figure 对象中的所有曲线。由于没有指定具体的 Figure 对象,因此会清空当前活动的 Figure 对象。如果需要清空指定的 Figure 对象中的曲线,可以先使用 figure() 函数获取指定的 Figure 对象,然后再使用 clf() 函数清空该对象中的曲线,例如:
fig = plt.figure(1)
plt.plot(np.linspace(0, 10, 100), np.sin(np.linspace(0, 10, 100)))
plt.plot(np.linspace(0, 10, 100), np.cos(np.linspace(0, 10, 100)))
fig.clf()
在这个例子中,首先使用 figure() 函数获取 Figure 对象 1,然后使用 plot() 函数画出两条曲线。接着使用 clf() 函数清空 Figure 对象 1 中的所有曲线。
您好,您可以使用Python内置函数open()来读取txt文件中的内容。以下是一些常用的方法:
您可以根据自己的需求选择不同的方法。如果您想要一次性读取整个文件,可以使用read()函数。如果您想要逐行读取文件,可以使用readline()函数。如果您想要一次性读取多行内容,可以使用readlines()函数。
以下是一个示例代码,演示如何使用Python读取txt文件中的内容:
with open('file.txt', 'r') as f:
content = f.read()
print(content)
请注意,这里的’file.txt’是您要读取的txt文件名,’r’表示以只读模式打开文件。如果您想要写入文件,请使用’w’模式。
基于kivy
https://kivy.org/
https://kivy.org/doc/stable/tutorials/pong.html
基于云的软件开发
https://appinventor.mit.edu/explore/get-started
https://blog.csdn.net/weixin_42619971/article/details/106314581
入门示例教程:
http://appinventor.mit.edu/explore/ai2/hello-codi.html
电脑网页端创建项目地址:
http://ai2.appinventor.mit.edu/
各位,今天有同学报,做出来的app安装到手机的时候,手机里的安全软件会报出病毒的提示。
是“误报”,大家不用理会。
App Inventor作出的应用均含有gray.app.inventor.a插件,该插件被绝大部分杀软识别为病毒。目前该问题尚未得到解决。该插件被误判为后台自动下载文件。
目前360卫士和百度手机卫士均已解除误判。
命名最佳实践:
常量(UPPERCASE|UPPER_CASE):不会发生改变的全局变量(注意Python本身并不支持C++中的const常量,这里仅仅是约定),由大写字母、[下划线]组成。通常用来保存默认配置的值。
模块、类、方法的私有变量|函数|方法(_lower_case):经常改变的模块级变量(模块内私有),类、方法的私有变量,由前置下划线、小写字母、[下划线]组成。
函数|方法|一般变量|参数|属性(lower_case):小写字母、[下划线]组成。
特殊方法(__lower_case__):通常用于操作符重载、容器定义等,由前置和后置双下划线与小写字母、[下划线]组成。一般是不用不上的。
类(CamelCase):驼峰式命名。
模块和包(lowercase):除特殊模块(如init.py)之外,小写不带下划线。
`OSError: [WinError 193] %1 不是有效的 Win32 应用程序。
一般报这种错误是由于引用的dll动态链接库和python位数不匹配。例如,python可能是64位但链接库是32位。
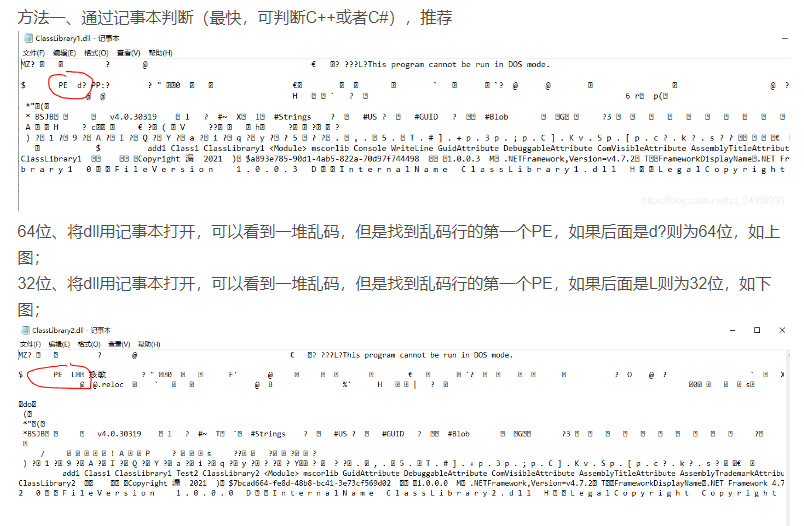
我把周立功can的链接库zlgcan.dll用记事本打开是PE L所以是32位,和64位的python不匹配。
exescope可以查看到version是1
网传可以使用depends读取dll信息,实际没有成功。
如果按照了visual studio,会有dumpbin程序,将其文件夹加入环境变量,可以使用该工具查看dll中的函数信息。
E:\mydoc\CAN相关\zlgcan_demo\python合集_20221029\python合集_20221029\python带界面demo\demo<!--autointro-->从网上搜集到两种解决办法:
1、执行以下命令(我是这样解决的)
sudo apt-get install libjpeg-dev zlib1g-dev
pip install Pillow
如果是python3,则将第二句改为:
pip3 install Pillow
2、更新pip版本
pip install –upgrade pip
set CONDA_FORCE_32BIT=1
使用
conda info查看
还是win-64!!切换失败了啊,然后就找到了如下解决措施
因为使用set命令设置环境变量在powershell中无效,所以我们更换如下命令即可
$Env:CONDA_FORCE_32BIT=1这样就成功切换了。
然后创建虚拟环境
conda create -n python32 python=3.6
(base) PS E:\mydoc\sync_pc_home_work\pyfile\DataExtract<!--autointro-->在使用Python matplotlib库的plt函数绘图时,可以采取以下几种方法来避免标题和坐标轴标签的重叠:
import matplotlib.pyplot as plt
fig, ax = plt.subplots(figsize=(6, 4))
ax.plot(x, y)
ax.set_title('Title', fontsize=16)
ax.set_xlabel('X Label', fontsize=14)
ax.set_ylabel('Y Label', fontsize=14)
在上面的代码中,通过设置figsize参数调整图像大小和尺寸,可以避免标题和坐标轴标签的重叠。
import matplotlib.pyplot as plt
fig, ax = plt.subplots()
ax.plot(x, y)
ax.set_title('Title', fontsize=16)
ax.set_xlabel('X Label', fontsize=14)
ax.set_ylabel('Y Label', fontsize=14)
plt.subplots_adjust(top=0.85, bottom=0.15, left=0.15, right=0.85)
在上面的代码中,通过设置top、bottom、left和right参数来调整坐标轴标签的位置,使它们不会重叠。
import matplotlib.pyplot as plt
fig, ax = plt.subplots()
ax.plot(x, y)
ax.set_title('Title', fontsize=16)
ax.set_xlabel('X Label', fontsize=14)
ax.set_ylabel('Y Label', fontsize=14)
plt.setp(ax.get_xticklabels(), rotation=45)
plt.setp(ax.get_yticklabels(), rotation=45)
在上面的代码中,通过设置rotation参数来旋转坐标轴标签,使它们不会重叠。
@python 将一串数字形式的时间转换为标准时间格式!!!
1.首先,确定你的那一串时间是10位还是13位的,
如果是10位请看方案一,13位请看解决方案二。
方案一:
10位的数字表示的是秒时间戳。
import time
time.time()#获取当前的秒时间戳
通过下边的代码就可以将10位的秒时间戳抓换为标准输出格式
import time
tupTime = time.localtime(1566366555)#秒时间戳
stadardTime = time.strftime("%Y-%m-%d %H:%M:%S", tupTime)
print(stadardTime)
#2019-08-21 13:49:15
方案二:
13位的数字串是毫秒级别的时间戳,通过下边的代码转换为表转格式:
import time
timeNum=1566366547705#毫秒时间戳
timeTemp = float(timeNum/1000)
tupTime = time.localtime(timeTemp)
stadardTime = time.strftime("%Y-%m-%d %H:%M:%S", tupTime)
print(stadardTime)
#2019-08-21 13:49:07